Five years researching the technical and human systems behind civic data—from data ingress and open-data workflows through platform strategy, delivery, and acquisition.
MY SCOPEPRODUCT DESIGN MANAGER → DIRECTOR, PRODUCT RESEARCH + DESIGNTEAMDESIGN, RESEARCH, PRODUCT, ENGINEERING, CUSTOMER TEAMS + GOVERNMENT PARTNERSTIMEFRAME2017—2022
TECHNICAL RESEARCH / DATA INGRESS
Research the pipeline, not only the interface.
Open-data work is a chain of technical and human decisions. I studied the full journey closely enough to help the team reason about the system: where data originated, how it entered the platform, what failed, how people recovered, and what trustworthy publication required downstream.
SOURCE SYSTEMS→FILES + CONNECTORS→INGEST→VALIDATE + CORRECT→MODEL + API→PUBLISH + USE
01 / GROUNDED MODEL
Interpretation stayed close to context.
Contextual inquiry, workflow reconstruction, scenario replay, iterative synthesis, and constant comparison helped move from individual observations toward an explanatory model—without stripping away the organizational conditions that gave each behavior meaning.
02 / TRIANGULATION
Every signal had a different job.
Interviews and advisory programs revealed intent. Usability work exposed interaction breakdowns. Analytics, coded NPS, and support patterns tested prevalence. System models and engineering evidence identified the constraints underneath the visible experience.
03 / ENGINEERING TRANSLATION
Findings became executable boundaries.
I worked directly with product management and engineering to turn the model into flows, error states, architecture questions, design spikes, prototypes, and an MBI. The research did not end at recommendation; it stayed active while the team determined what the platform could reliably ship.
RESEARCH → SOFTWARE
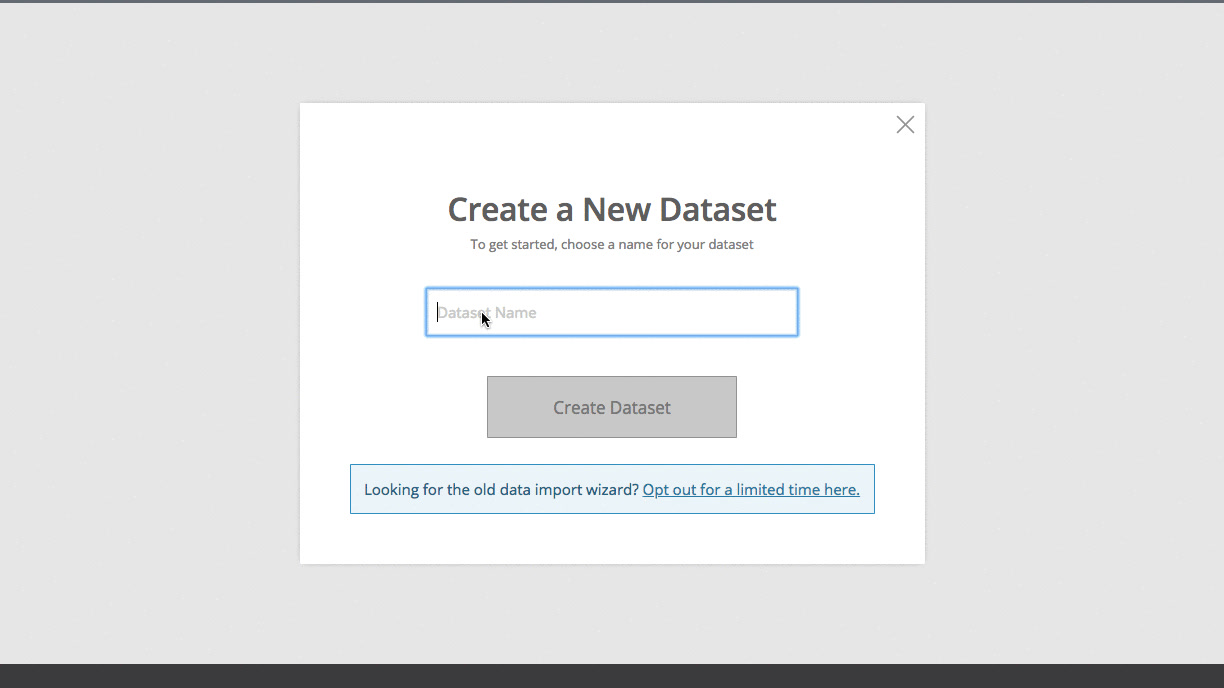
The resulting error-correction workflow let people repair problems during ingress and helped establish the path toward the backend that powered Socrata’s open-data platform for the following five years.
01 / THE PROBLEM
Socrata had a valuable family of products for publishing, exploring, analyzing, and communicating public data. But customers experienced the seams between those products, while the organization needed stronger shared ways to learn, plan, and deliver across them. The challenge was larger than improving individual screens: make the portfolio more coherent while building a research and design practice capable of guiding it.
02 / THE EVIDENCE
I worked across data publishing, shaping and modeling, administration, mobile navigation, tenancy, visualization, and big-data initiatives. My grounded-theory practice treated interpretation as situated and iterative: contextual research and scenario replays built the model, while customer advisory work, Socrata Connect sessions, usability studies, product analytics, coded NPS, and product user groups tested its reach and exposed contradictions.
Connected Communities
Organism
Platform
Data
Operations
People
Partners
Molecule
Program
Datasets
Models
Reports
Actions
Atoms
Data collection
Data shaping
Metadata
Visualization
Read the original element analogy
Land Use (Lu) was an example atom. Its “atomic number” represented departments; groups represented verticals and periods represented segments. The original cost-per-1,000-citizens field was posed as a question, not an established measure.
03 / THE DECISION
Treat product coherence and organizational capability as the same design problem. I helped establish a portfolio-wide Product User Group (PUG), Voice of Customer (VoC) program, Customer Advisory Board (CAB), recurring usability and research studies, NPS and analytics review, and shared planning rituals. Together, those programs carried evidence across teams and kept planning centered on what government teams needed to accomplish—not the boundaries between Socrata applications.
UX program strategy
Annual cadence · proposed reconstruction for review
Q1
Jan●Feb●Mar●
Monthly: research touchpoint → synthesis → share with product teams.
Quarterly: review evidence → align priorities → plan the next cycle.
Q2
Apr●May●Jun●
Monthly: research touchpoint → synthesis → share with product teams.
Quarterly: review evidence → align priorities → plan the next cycle.
Q3
Jul●Aug●Sep●
Monthly: research touchpoint → synthesis → share with product teams.
Quarterly: review evidence → align priorities → plan the next cycle.
Q4
Oct●Nov●Dec●
Monthly: research touchpoint → synthesis → share with product teams.
Quarterly: review evidence → align priorities → plan the next cycle.
Documented programs
Product User Group · Voice of Customer · Customer Advisory Board · Usability and contextual research · Analytics and NPS
Exact program-to-month assignments, participants, and quarterly actions are open for Mat’s readout. This is a planning scaffold, not a record of completed sessions.
04 / THE COLLABORATION
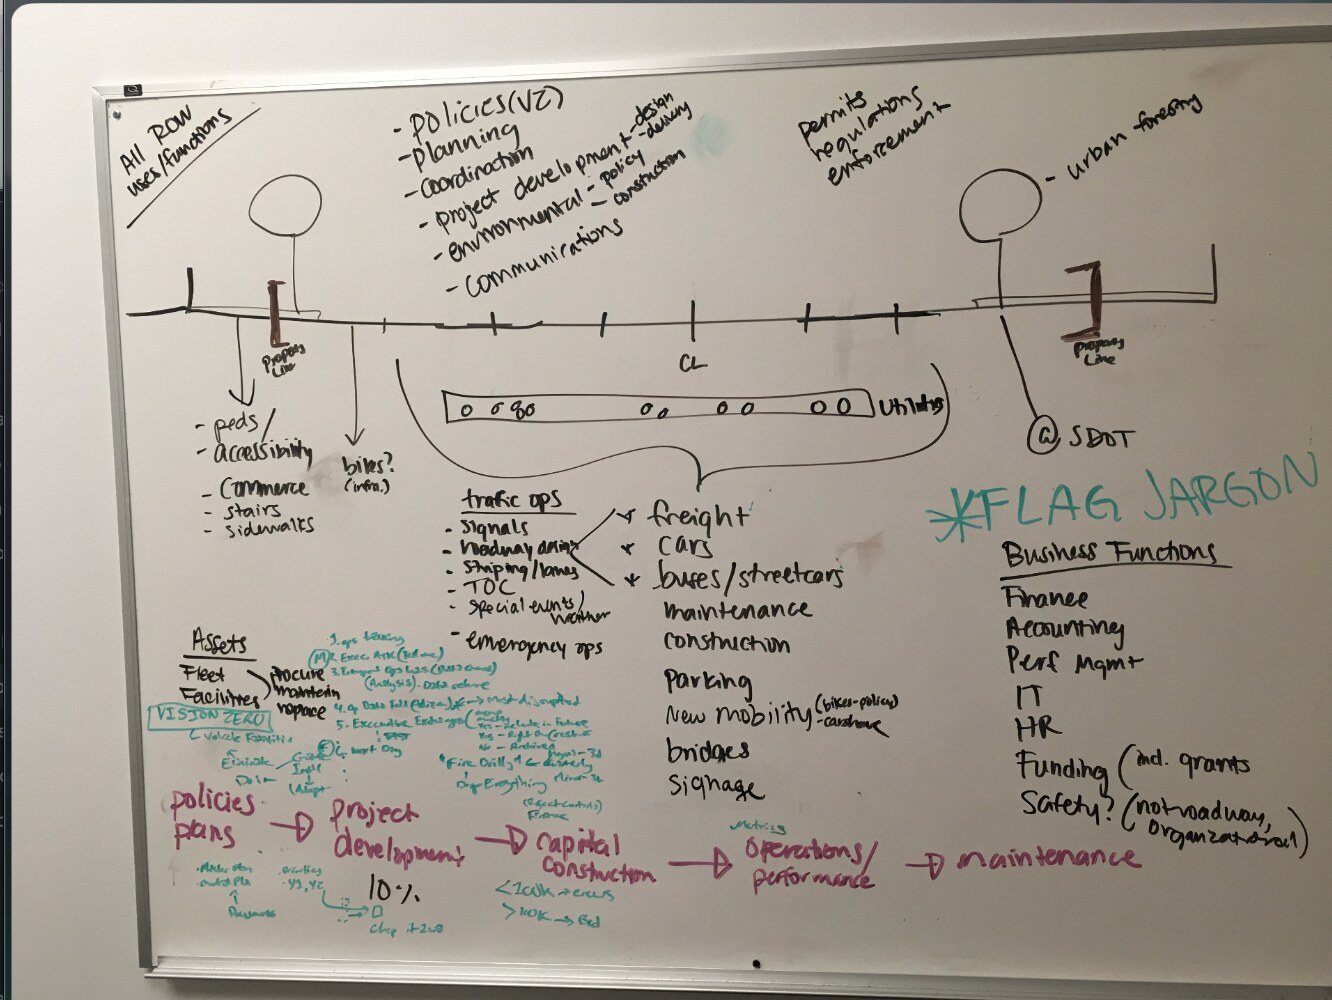
I operated as a player-coach: leading designers and researchers while staying close to consequential product work. For the 2018 MVP launch, I embedded with the Ingress product and engineering team, researching the path from source data through import, validation, error correction, shaping, and publication. Architecture maps, scenario tests, design spikes, and working prototypes let us examine system boundaries and failure modes together—then translate evidence into an intentional minimum business increment.
2018 MVP LAUNCHINGRESS TEAM
PRODUCT MANAGEMENTDESIGN LEAD MATHIAS BURTONENGINEERING
GETTING DATA INTO THE PLATFORM
05 / THE OUTCOME
The work helped bring Connected Government Cloud to market and created a more connected story for the Socrata portfolio. After Tyler Technologies acquired Socrata, integrating workflows became a major UX undertaking: we modeled the work already happening across Tyler products, translated Socrata’s product logic for new colleagues, and used those models to shape shared product, research, and design capabilities. That foundation carried into Tyler Forge, cross-division product vision, and the emerging Tyler Data & Insights suite.
Data & Insights architecture
Data & Insights
Connected Government Cloud
Citizen engagement
Socrata
Citizen Connect
Open Data
Open Finance
Open Performance
Financial insights
Socrata
Budget
Capital Projects
Expenditures
Payroll
Insights Dashboard
Performance optimization
Socrata
Performance Cloud
Operational intelligence
Socrata
Data Lens
X-Connect
Incident Alerts
06 / THE REFLECTION
Many of the disciplines I still carry as a designer and manager were formed here—working in person, making ideas physical, and using rooms, walls, cards, and conversation to build shared understanding. I also learned how strongly context shapes a role inside a startup. My work changed as Socrata moved from Series C growth, through acquisition, and out the other side: from designing products, to building a practice, to helping an integrated portfolio move together.
WORKING PHYSICALLY / CONTEXT, LANGUAGE + SHARED UNDERSTANDING
PROJECT EVIDENCE
01 / Built for a 2018 minimum business increment (MBI)—an intentional release shaped around a customer value proposition—just after the MVP and Tyler announcement, this ingress feature let people correct data errors on the fly. It also helped pave the way for the new backend that powered Socrata’s open-data platform for the next five years.
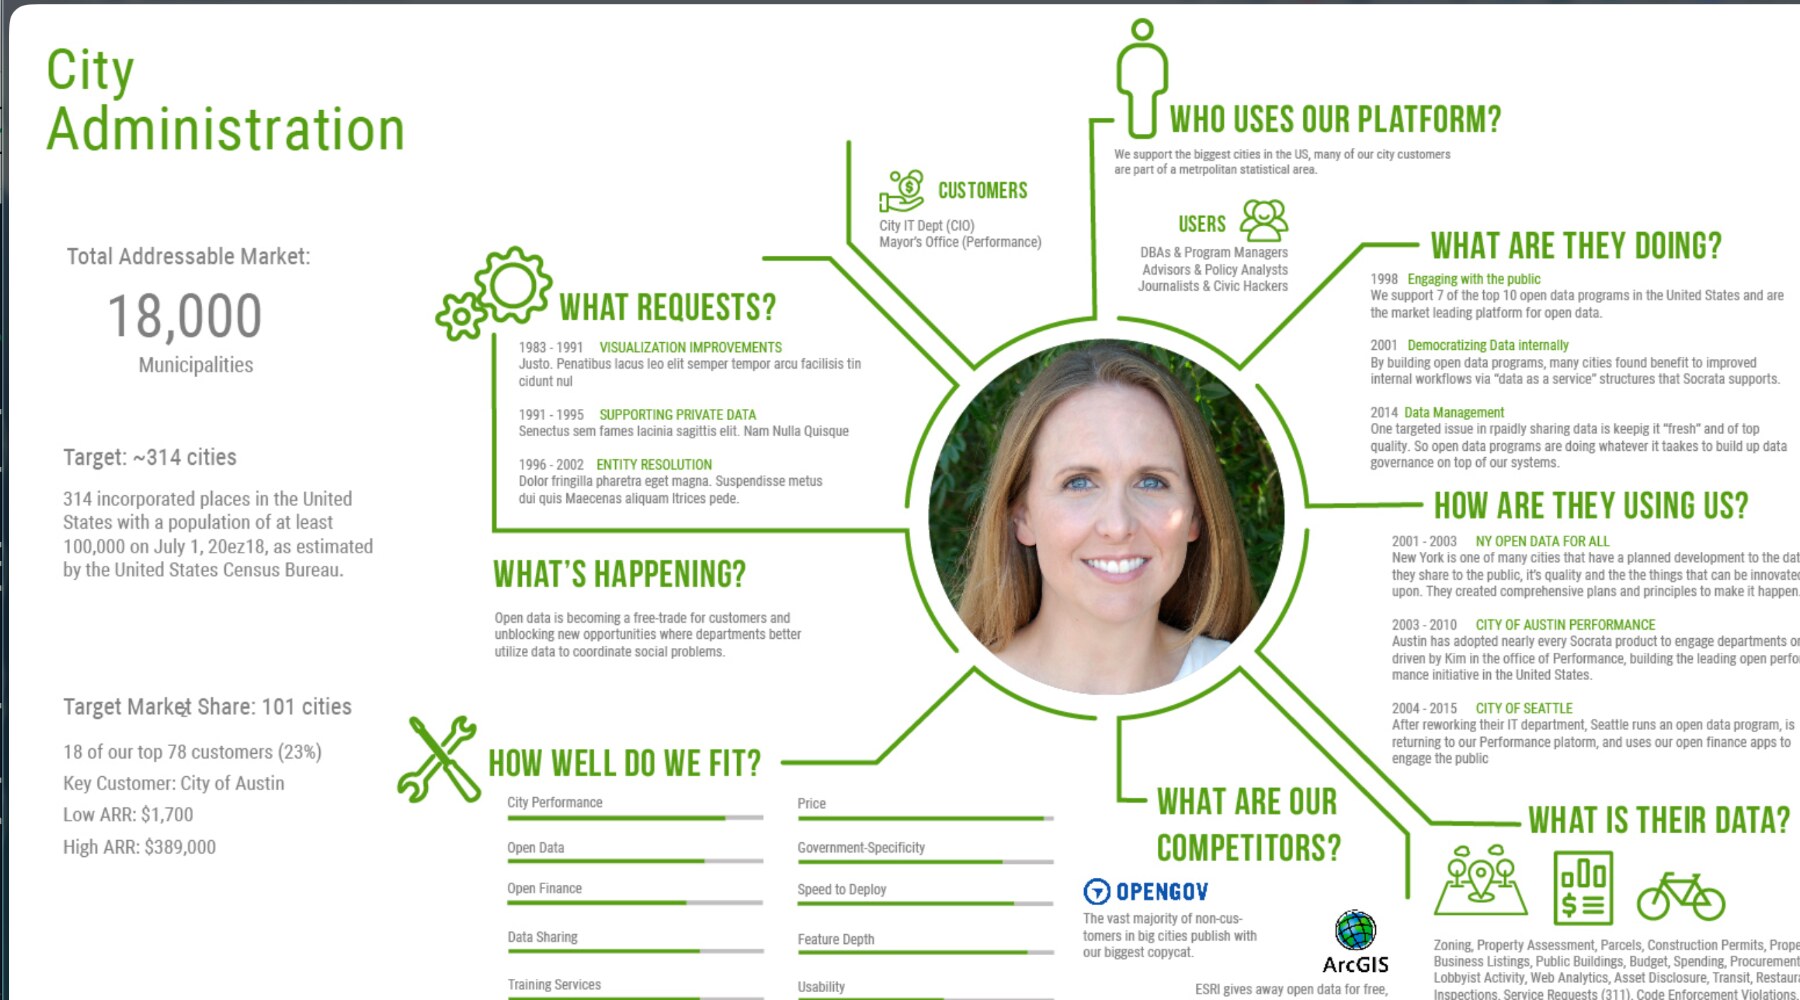
02 / We made separate profiles for customers and user personas. The City Administrator card helped sales understand the department they were speaking with, its market scale, and its intersection with Socrata. More than a persona, it combined user research and market research compiled by my team and, in many cases, by me directly.
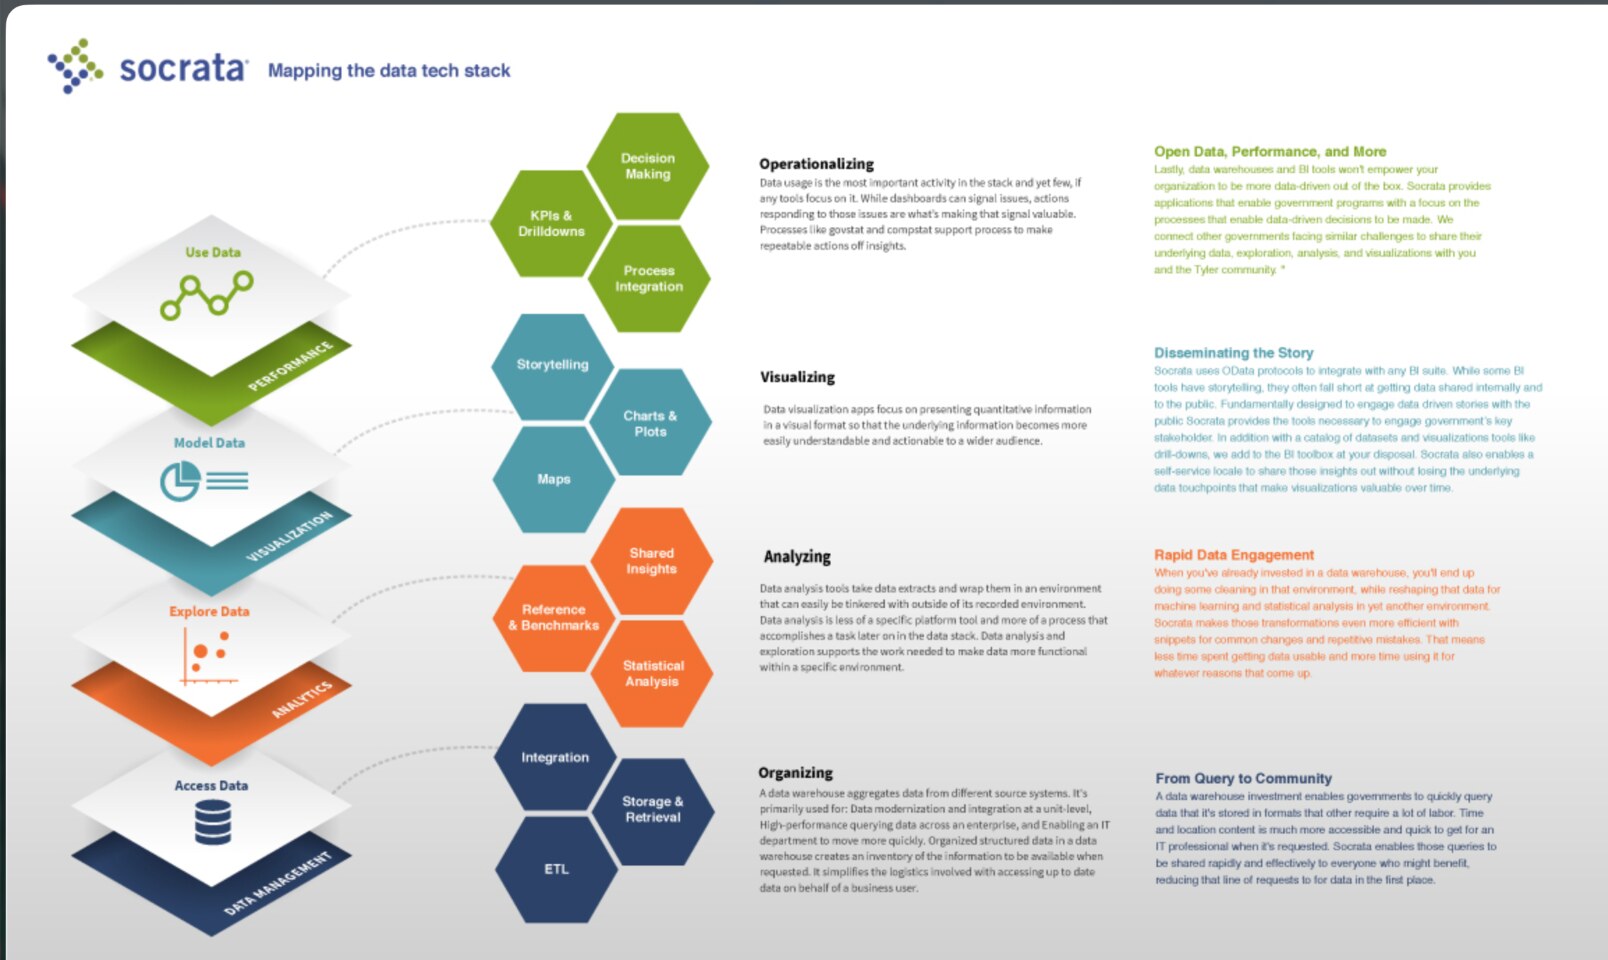
03 / Mapping the data tech stack organized access, exploration, modeling, and use as a progression from raw information to decisions and public action.EXPLORE THE INTERACTIVE STACK ↗
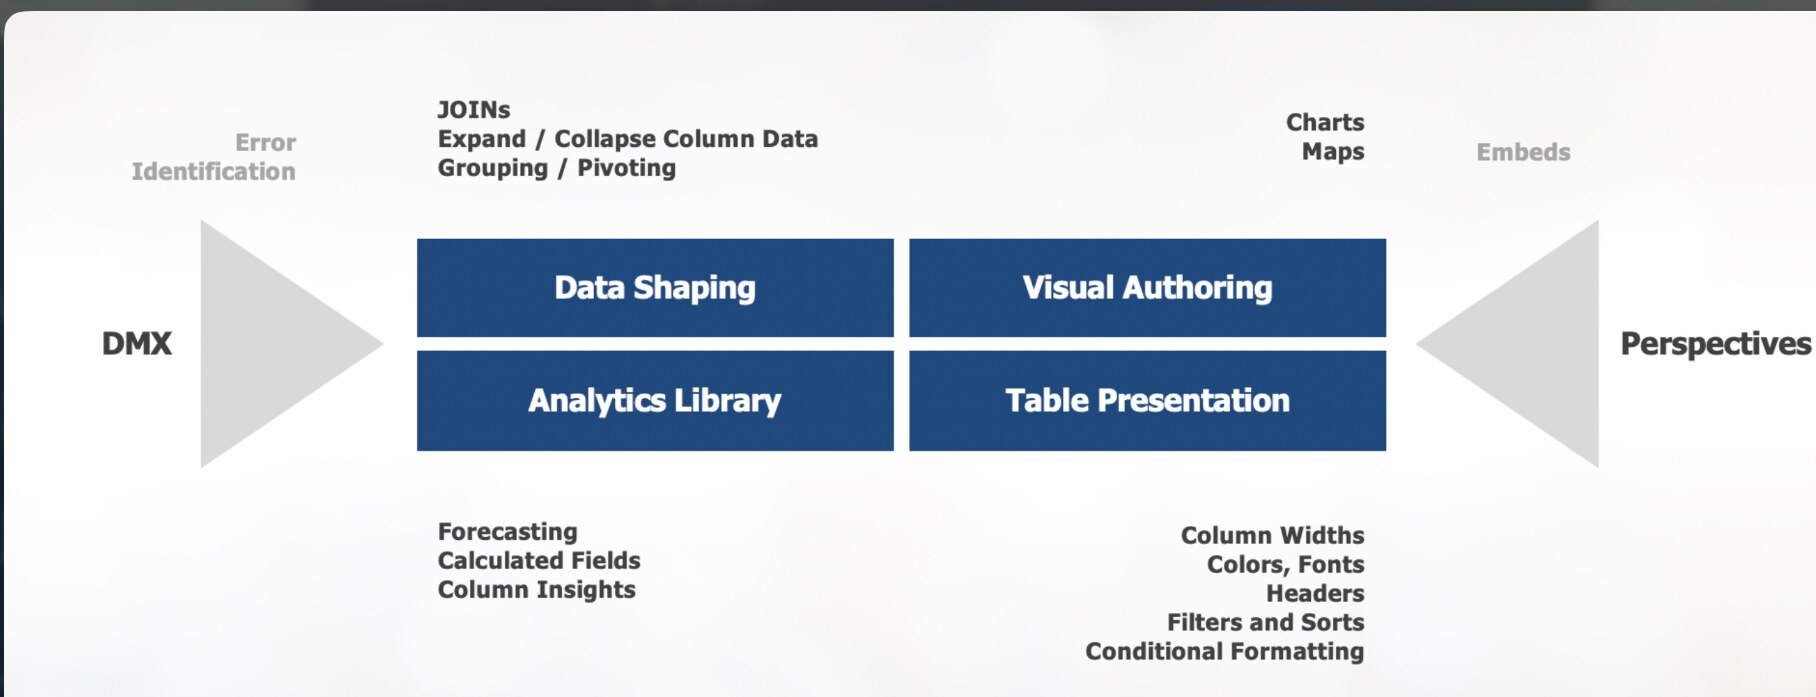
04 / The architecture separated reusable capabilities—data shaping, analytics, visual authoring, and table presentation—from the experiences built on top.