I study how experts make decisions inside complex technical systems.
Even in leadership roles, rigorous research is the foundation of my practice. I work to deeply understand the experience of a user, a customer, or a person navigating a complex system. I also generate ideas directly from the research I conduct—using sketches, proposals, and prototypes to make findings tangible and easier to act on.
Private debt investor and the team supporting them. Deal leads and advisors were compared in the research.
Timeline
2022–2024
Aug–Nov 2022Discovery research
Jan–Mar 2023Domain research
Apr–Jun 2023Contextual research
Jul–Aug 2023Usability testing
Nov 2023Customer feedback sessions
Jan–Feb 2024Editorial research
Research questions
PitchBook acquired LCD, bringing together qualitative analyst commentary, specialist credit data, and an existing financial-data platform. The integration question was not simply where to place the new information. We needed to understand how credit professionals used it differently depending on their role, institution, authority, and the stage of a live deal.
Studies / investigation
I conducted contextual inquiry, phone interviews, working-session replays, and complete-deal walkthroughs. I compared the work of deal leads and advisors, modeled roles and decision points, analyzed private-credit transactions, and studied how editorial and customer taxonomies aligned. One taxonomy study involved 30 editors and 20 customers across more than 40 categories.View the card-sort study →
Findings
What began as a single user became a team of dedicated roles. Team hierarchy and a person’s position on a deal changed the information they needed and could access. These differences had critical implications for the interface: which data to show, how to organize it, and how to support the decisions each role could make.
01
Search for a debt deal
02
Advanced search
03
Set deal criteria
Choose asset class
Size & scope
Risk profile
04
Filter & sort results
Narrow types
Sort spreads
Filter range
05
Review a specific deal
Review skeleton
Download data
Save access
06
Save a deal to return to
See changes
Explore from base
Remove from list
A model of searching, evaluating, and returning to deals in the debt market.
Evidence → decisions
Time constraints tied to the acquisition of LCD from S&P made prioritization urgent. Focusing on the CLO market helped us improve and integrate the most valuable data for key accounts before expanding across private debt. The research shaped the credit dashboard, deal-sheet information architecture, CLO data architecture, and the sequence of the wider integration roadmap.
Program owners, data stewards, IT teams, platform administrators, publishers, and downstream public users.
Timeline
2017–2022
2017Mixed methods and action research with government programs and program managers
2018Domain inquiries: transportation, housing / land use, and permitting
2020CDC response research and public data analysis
2021UX program planning: Product User Group
H2 2021Voice of Customer data collection
2022Tyler research repository and data-sharing program
Research questions
Government data could pass through source systems, spreadsheets, program owners, data stewards, IT teams, platform administrators, and public users before becoming useful. When something failed, the visible error was often separated from the decision or transformation that caused it. We needed to understand the entire publishing system well enough to help teams diagnose and repair it.
Studies / investigation
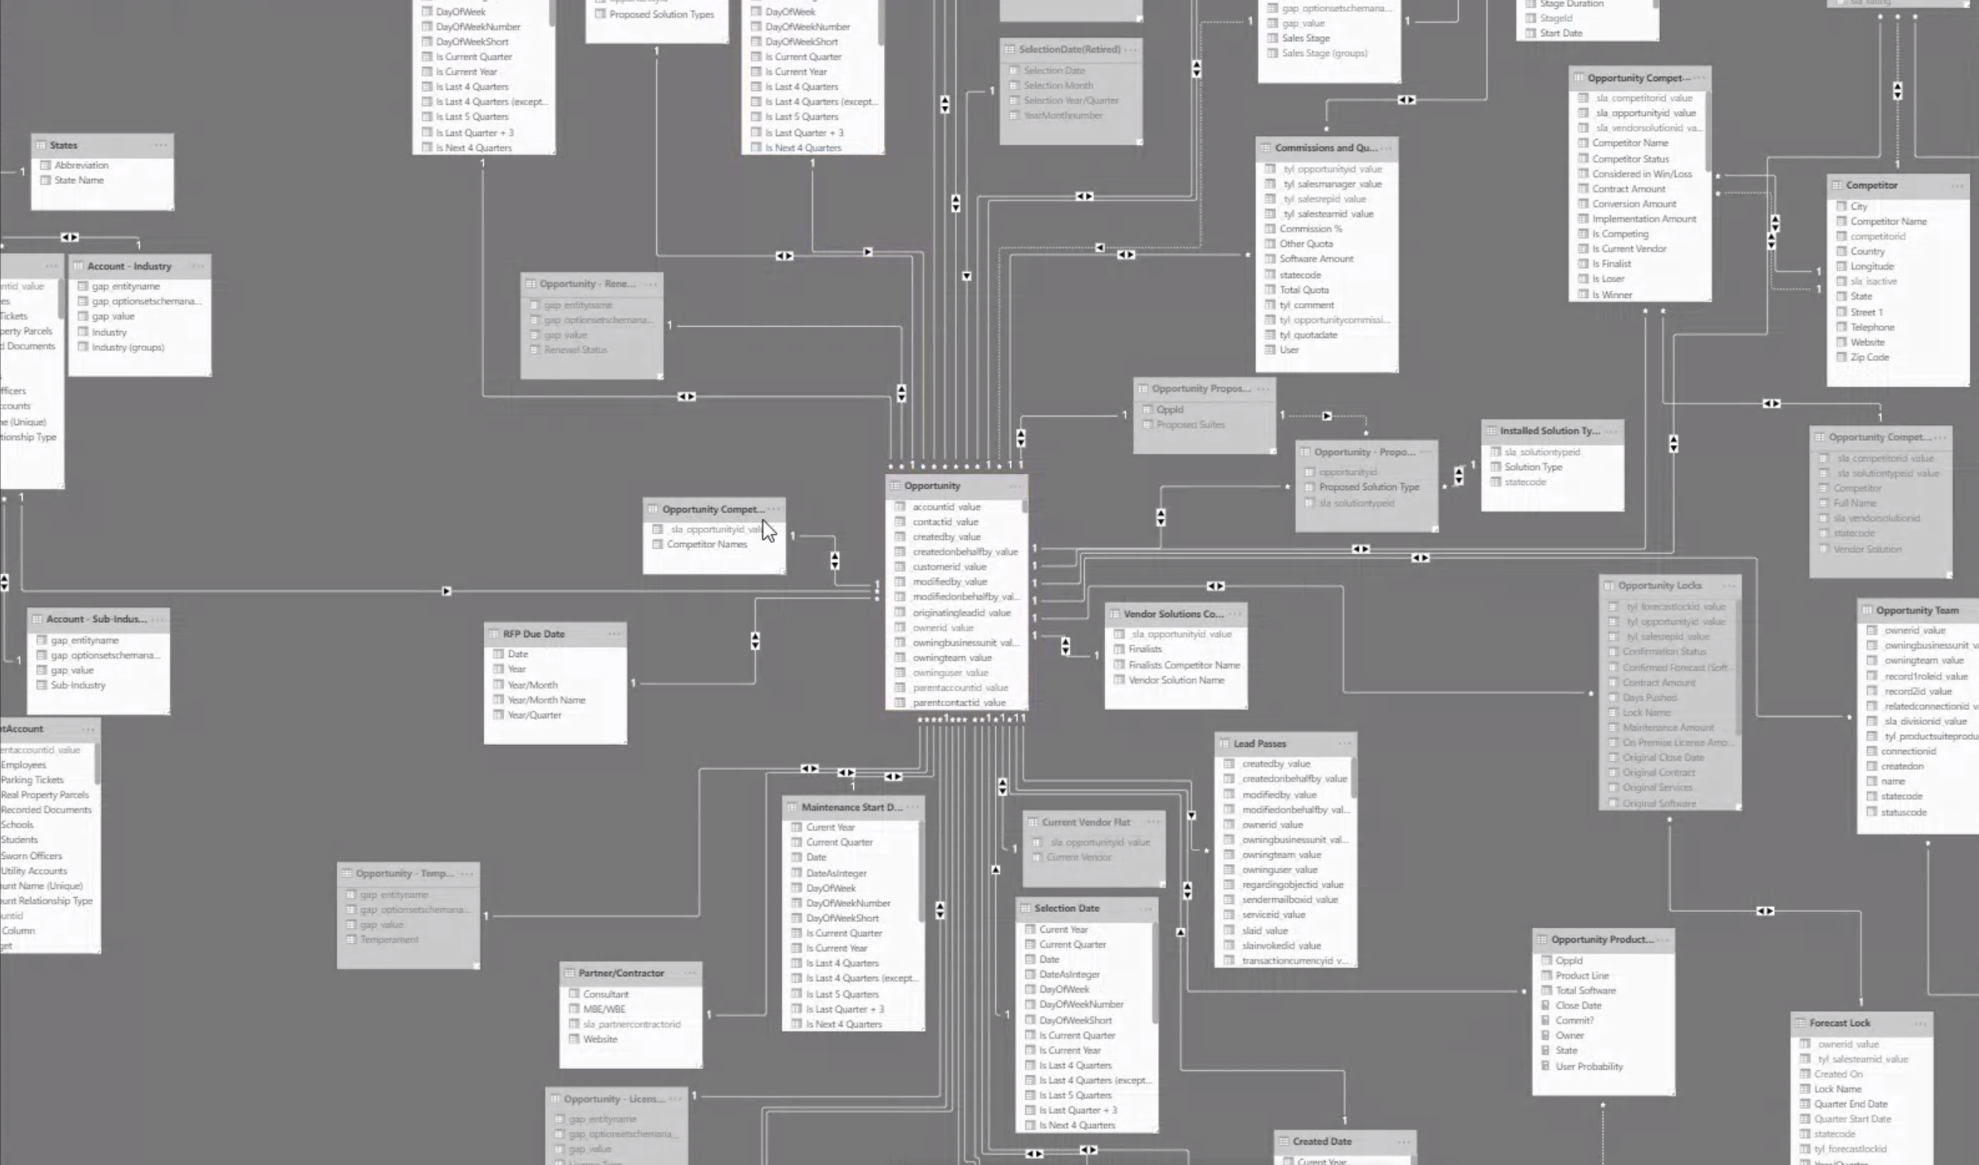
I analyzed 30–40 hours of inherited interviews, conducted additional interviews, reconstructed publishing and ingress workflows, and examined product analytics, NPS evidence, system logs, and advisory-board feedback. I worked across transportation and other government domains, built architecture and service models, and used scenario testing, design spikes, and prototypes to make the emerging system concrete.Technical research: database structuresWe examined database structures to understand how changes to the backend could enable features in high demand among larger governments. This map then helped us trace how a program manager gets information from a centralized IT group. The source is dense; it is included as supporting evidence of the technical investigation.
How do we model a government problem?
Obtain the data
Request a dataset
Review existing datasets
Extract from a database
Set up a connector to DB
Find / write metadata
Explore the data
Identify / find outliers
Analytical review
Extract available insights
Track down questions
Add more data
Add content / context
Model the question
Identify relations
Make new relationships
Categorize / bucket data
Encode information
Set base visualizations
Refine and clean up story
Shape data
Visualize it
Plan visualizations
Consolidate presentation
Reshape data for needs
Automate / systematize
Iterate on assets
We used this simplified outline to shape discussions about the problems governments are asked to take on: obtaining and exploring data, modeling the question, and visualizing it. It helped connect the stated problem with the work required to investigate it.
Findings
Open-data publishing was distributed work. Program owners understood the meaning of the data; technical teams understood its infrastructure; publishers were responsible for its public quality; and downstream users depended on provenance and consistency. Most failures appeared at the handoffs between those responsibilities. Teams needed visibility, lineage, and correction—not simply faster ingestion. We also found that users cared about specific assets, but the term meant different things across the user base. Understanding what each person meant was essential to modeling the program and its information.
Program assets
Users cared about specific “assets,” but the word meant different things across the user base. This model makes the relationships between datasets, models, views, publishing, and the people creating and consuming them explicit.
Add a dataset: roles and handoffs
01
Extract
Transform
02
Load
Transform
03
Dataset metadata
Fix errors & refine ingress
04
Column metadata
Fix errors & refine ingress
05
Publish
Automate ingress
I created this DMX workflow model to show where work passed between users in complex agencies. Following a dataset from extraction through metadata and publication made the handoffs—and the work of fixing errors and refining ingress—visible.
Housing affordability as a program
01
Government data
Land use
Permitting
Budget
Neighborhoods
Asset management
Code enforcement
02
Land parcel
03
Questions
Makeup of neighborhood?
Density of neighborhood?
Food deserts?
Transit gaps?
Avg. rent? Home price?
Vulnerable populations?
04
Planning needs
Predicted growth
Scenarios
Outreach priorities
05
Audiences
Planners
Residents
Mayor
City council
Renters
Prospects
From our research into government programs, I mapped clusters of data and the people who use them alongside program needs and the questions they receive. This housing-affordability example connects land use, permitting, and neighborhood data with planning scenarios and audiences.
Evidence → decisions
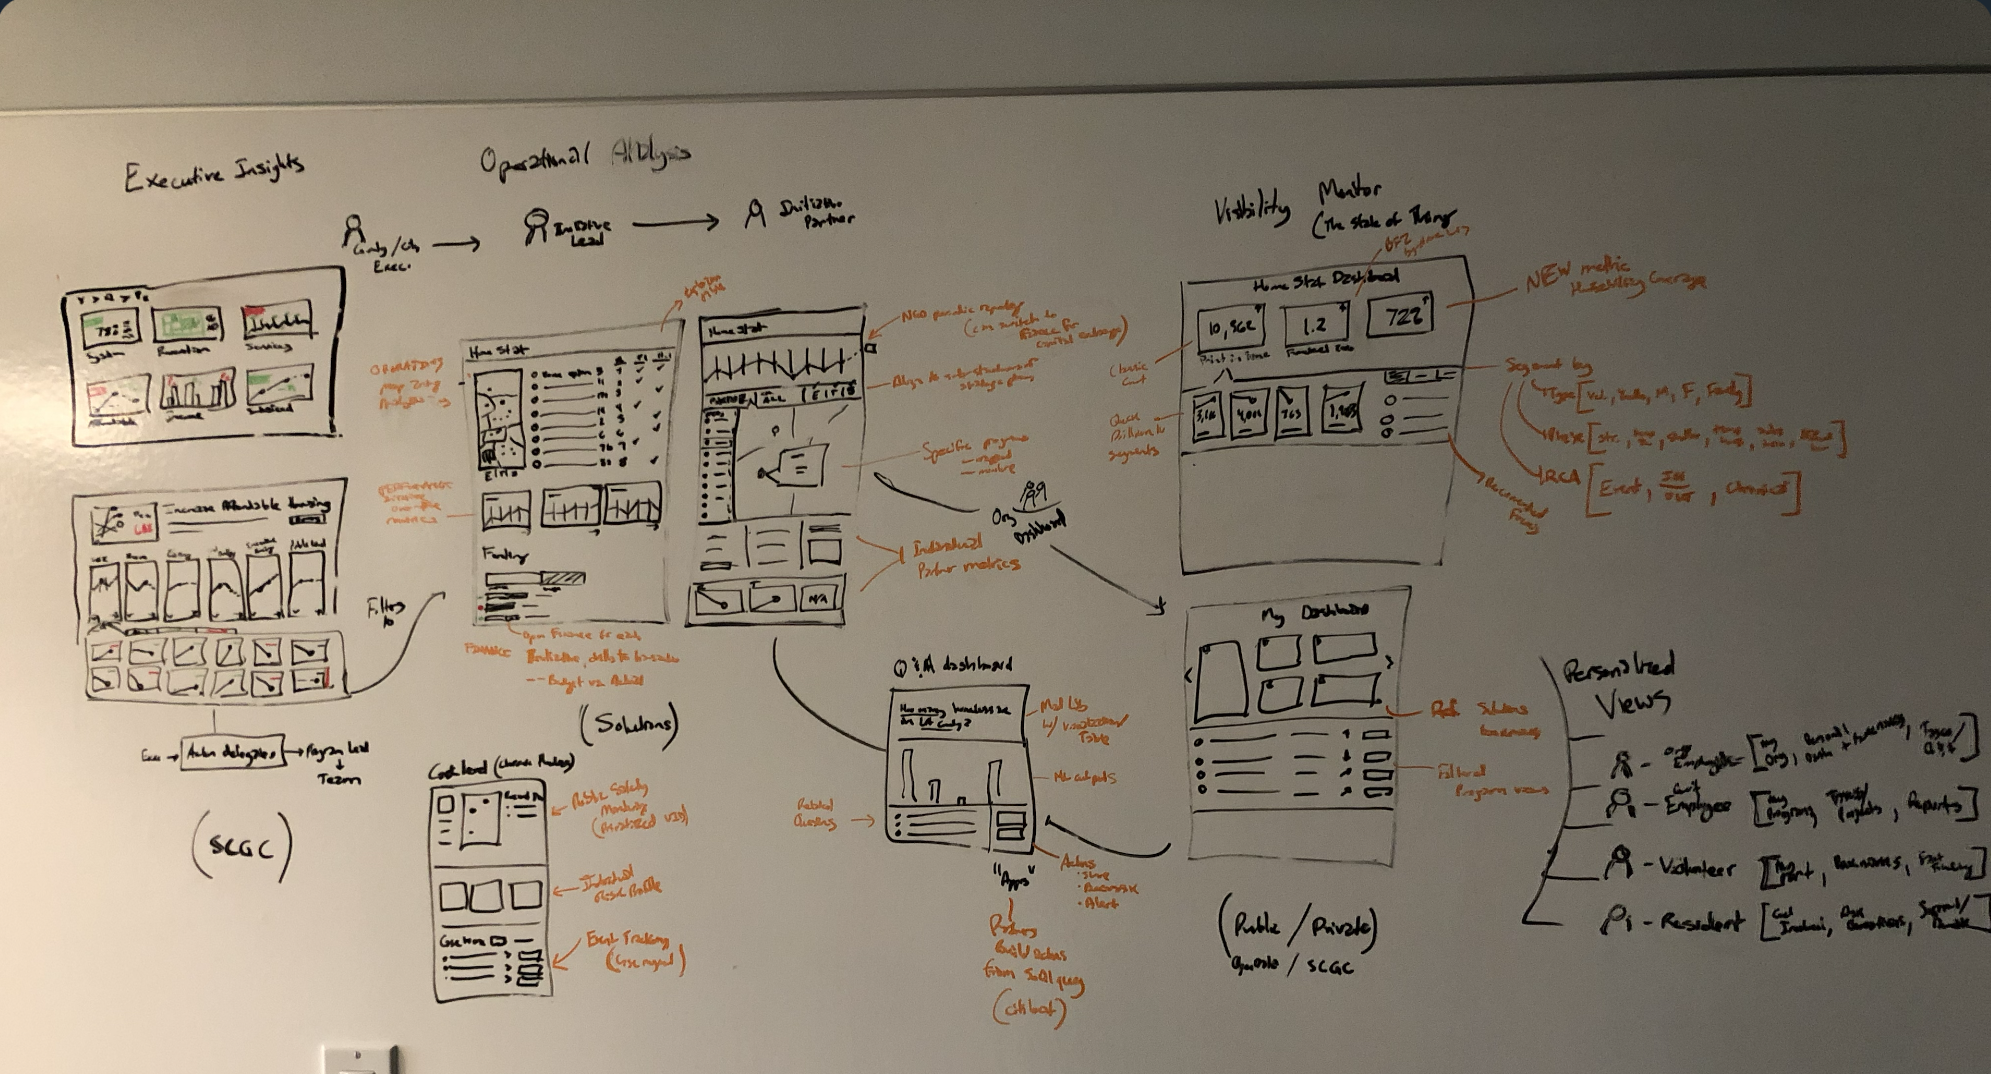
The research informed error-correction capabilities and the longer-term direction of Socrata’s data-management and ingress platform. I carried the workflow model and product narrative with product management and worked directly with engineering as the findings became releasable software.Research leads to ideas. This whiteboard prototype grew out of a research debrief about the program manager role in the context of a specific department. Sketching made the findings concrete enough to discuss possible workflows and interfaces—a step from understanding the work toward proposing how to support it.
From key results to a scenario
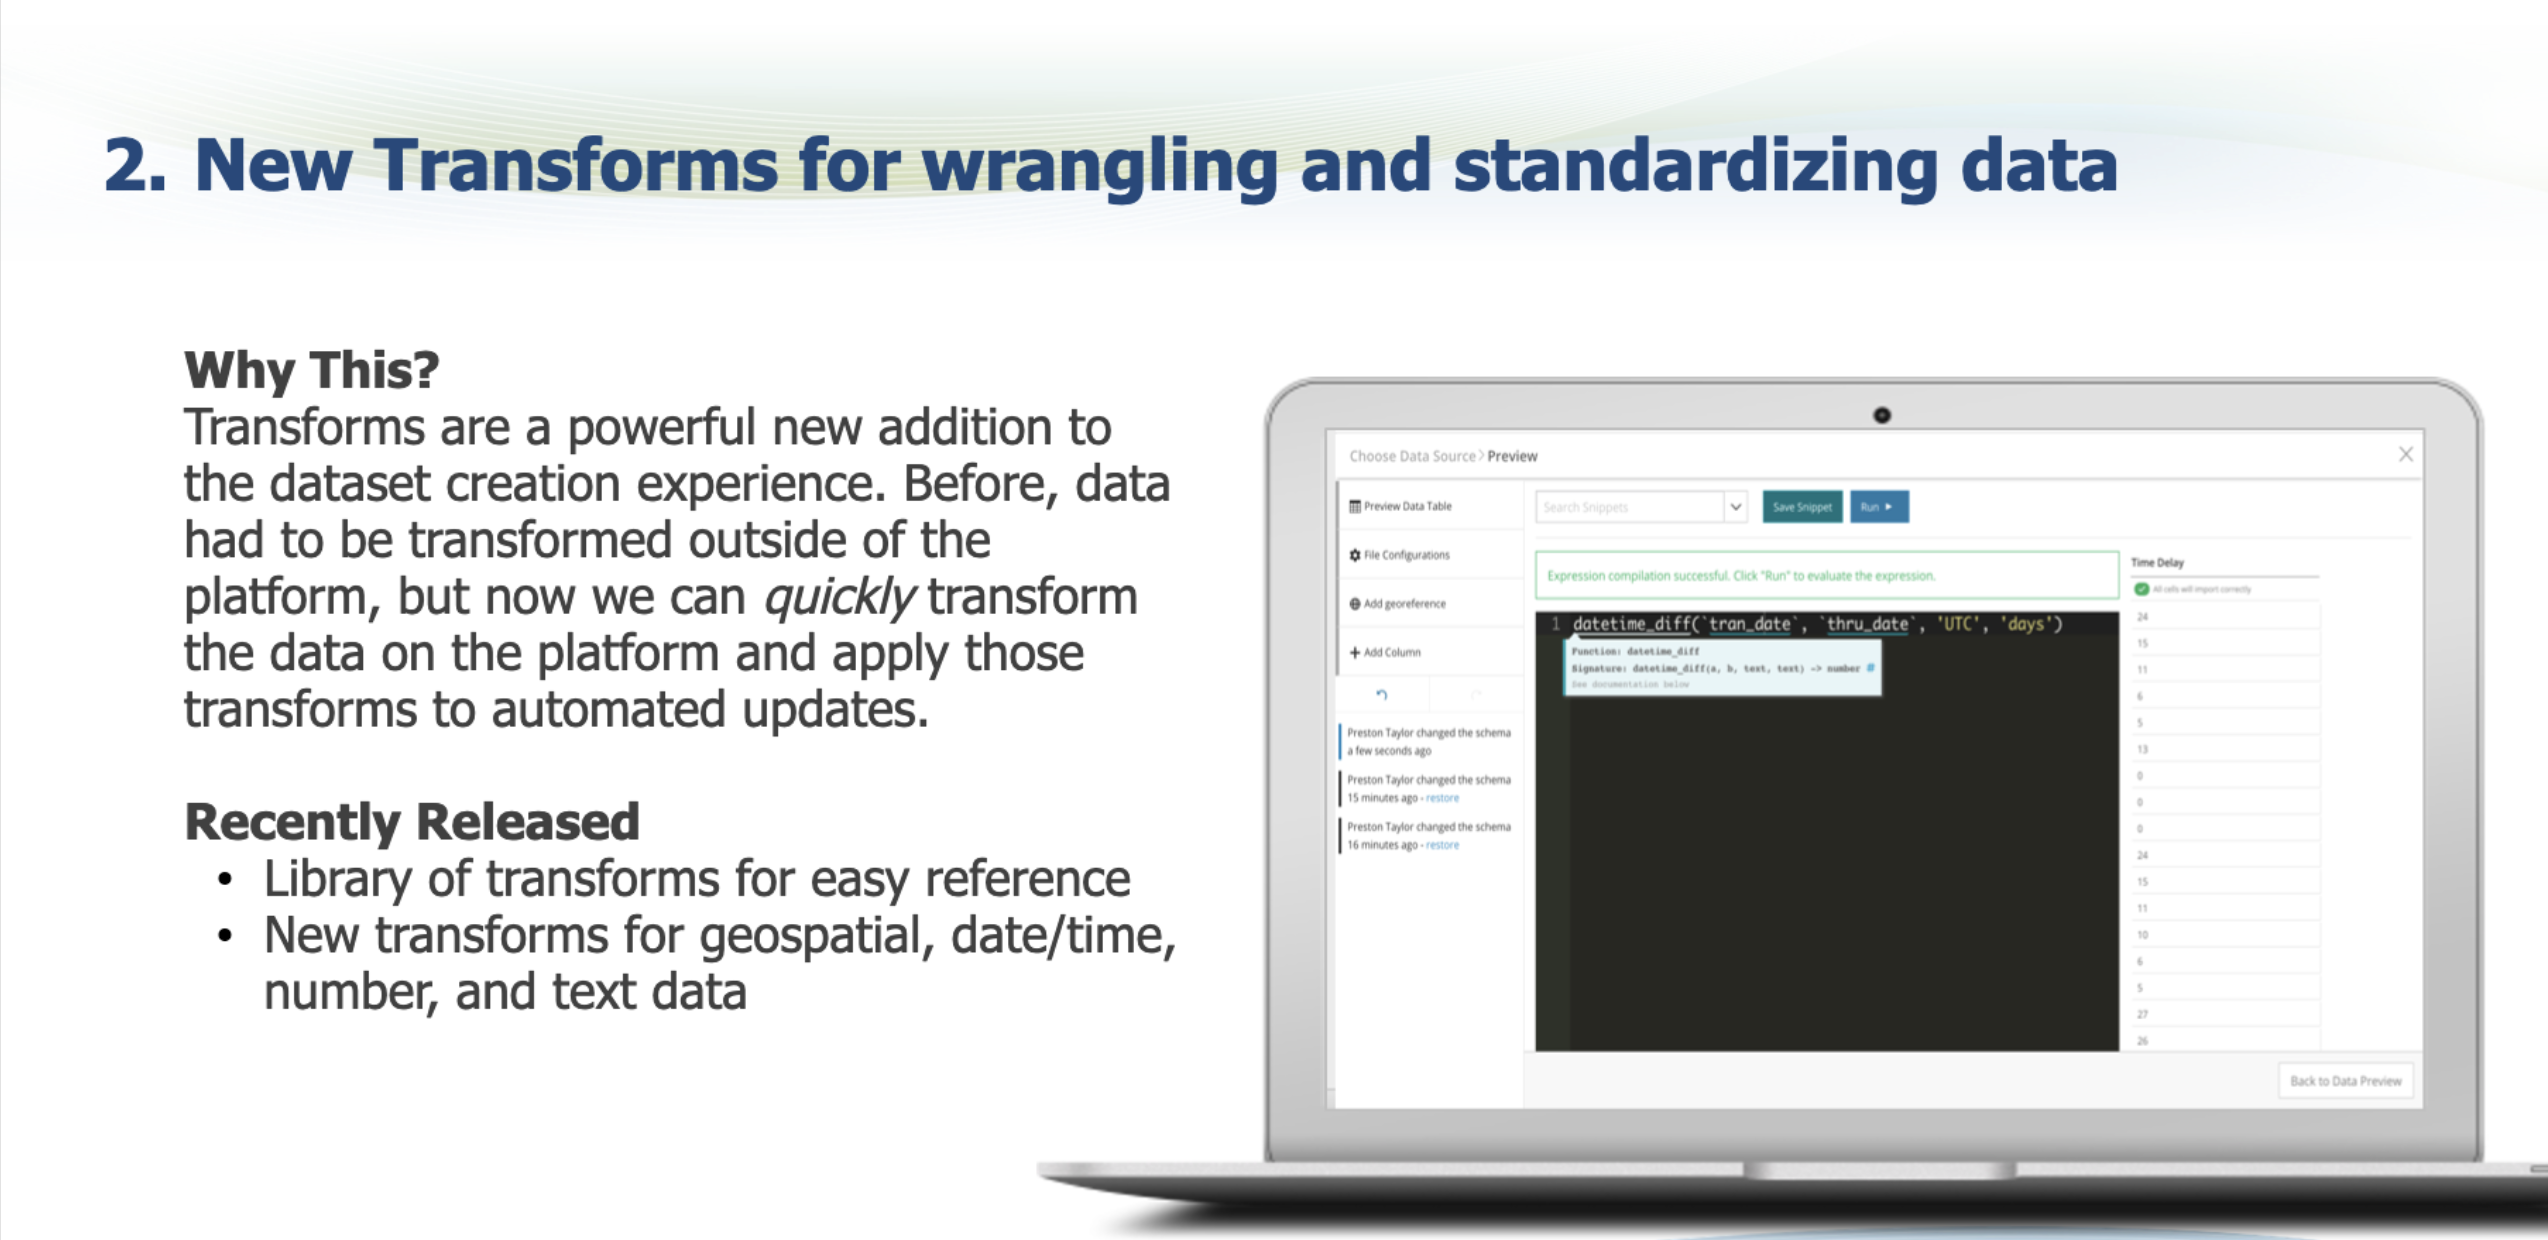
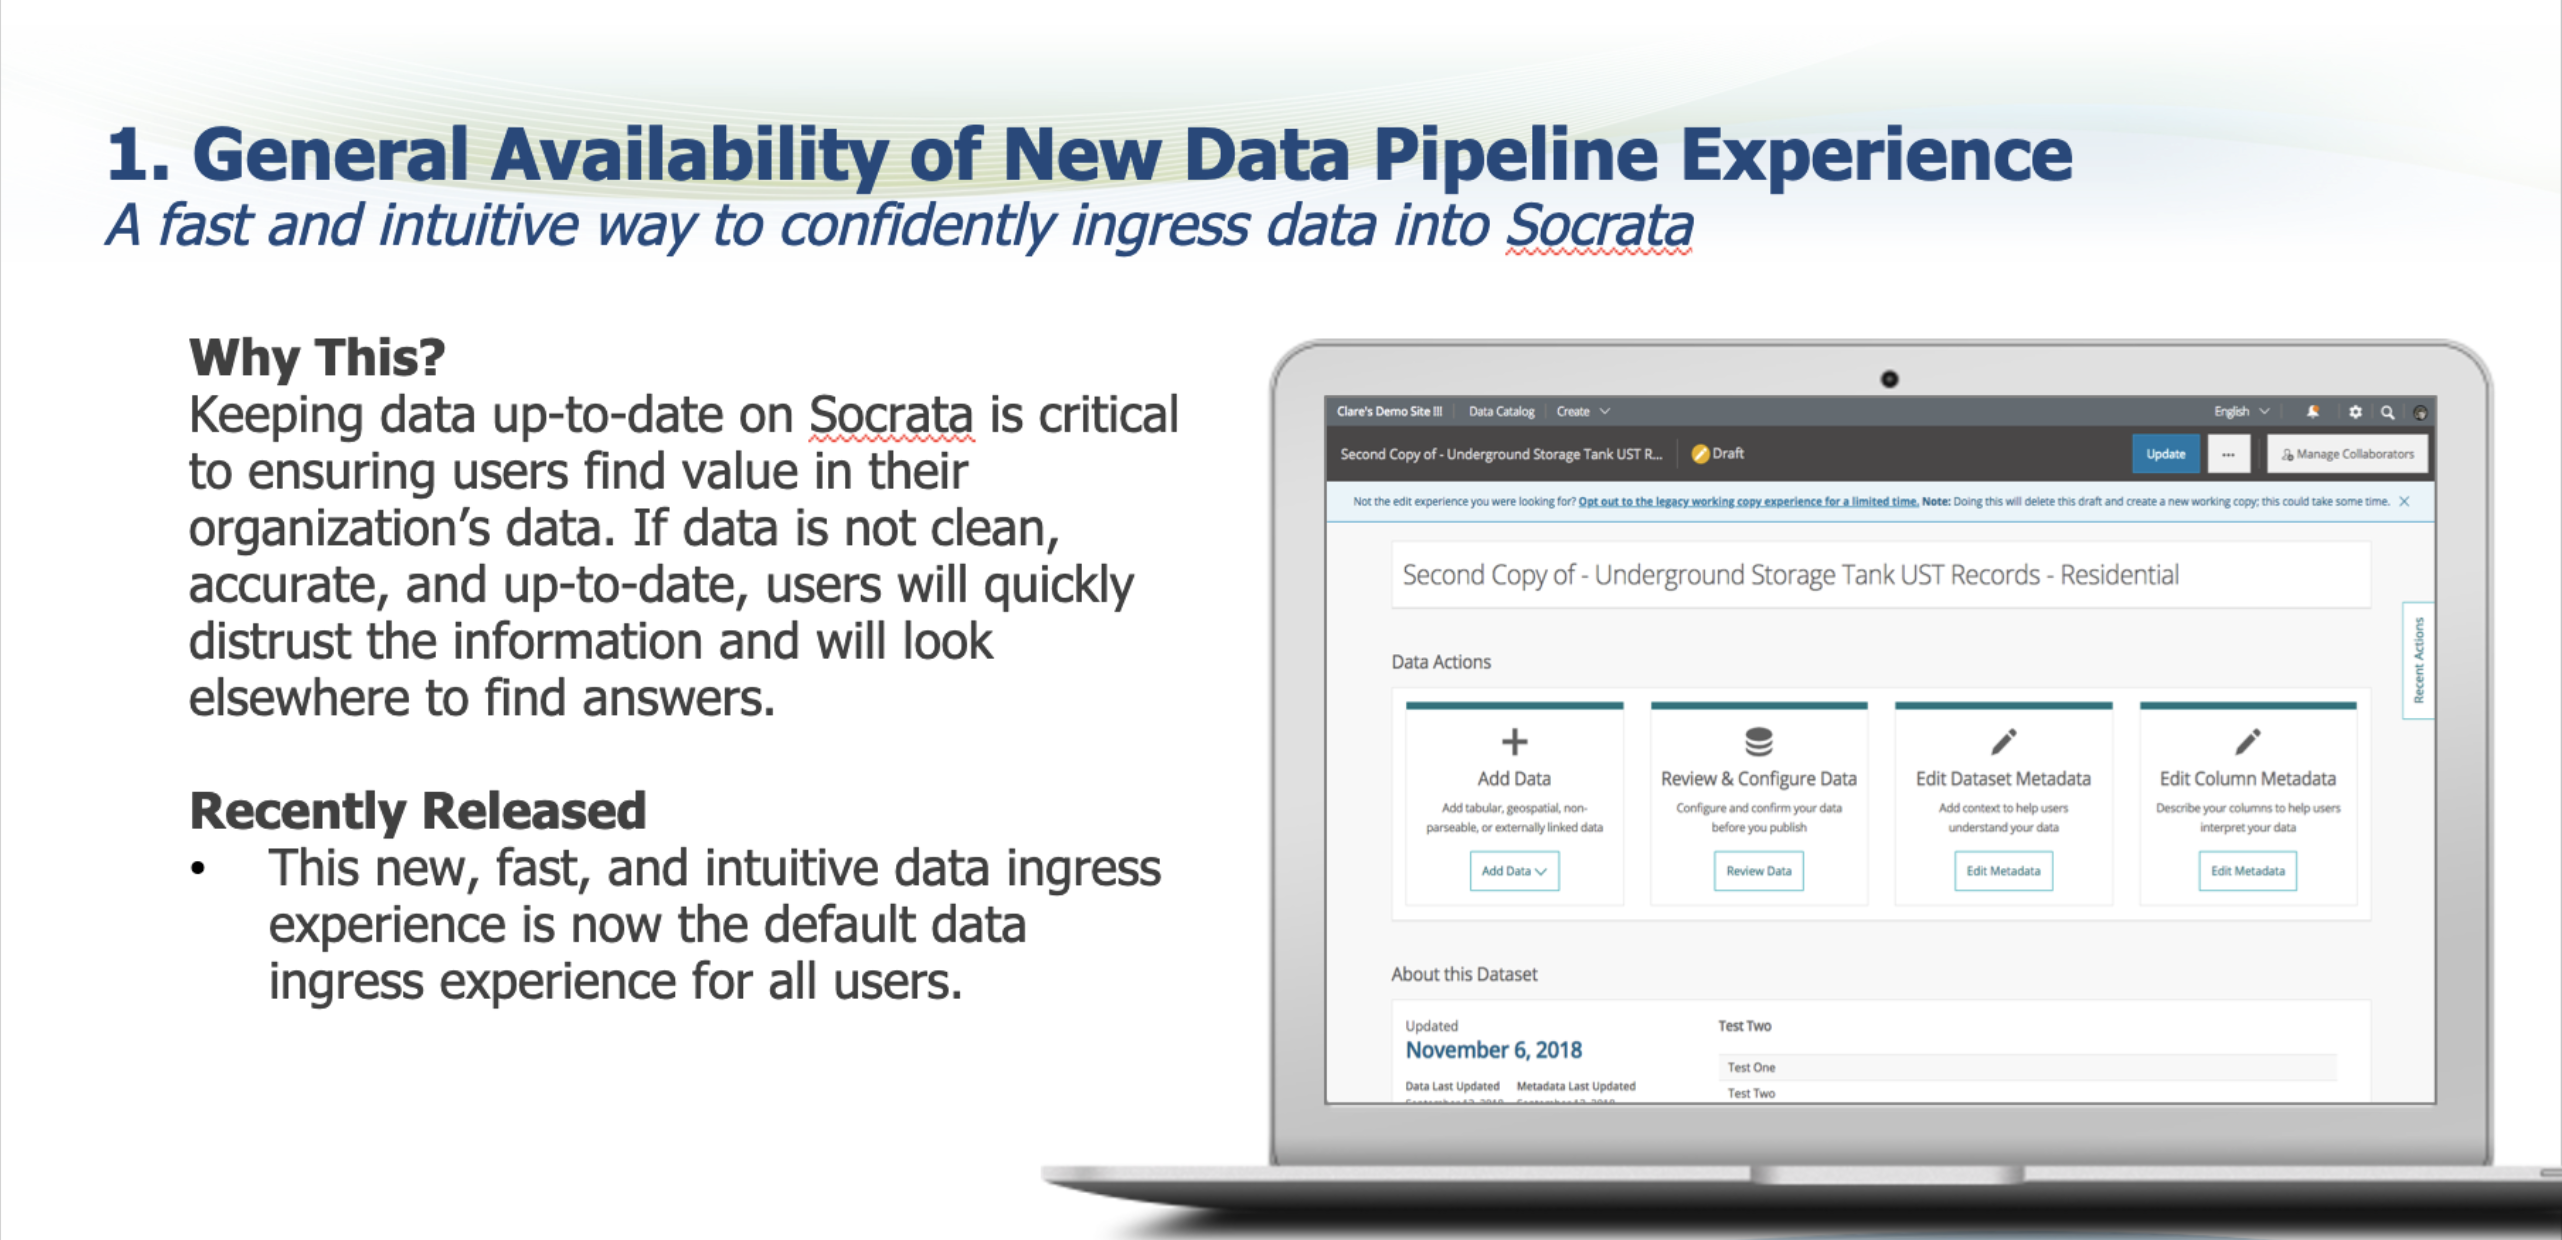
Research used directly in design. This working artifact captured a discussion about government key results and how a data scenario played out. Although dense, it helped clarify the specific features that overlapped in that scenario. My design lead made direct use of it.Ingress research showed that technical users repeatedly encountered the same errors. We built transforms that let them automate error identification and reuse data-cleaning logic during updates, bringing recurring work into the publishing workflow.We used prospective feature mockups to start customer conversations, then worked backward to understand their needs in the import process. That research became a shipped feature that continues to shape government data publishing across the broader Tyler platforms. This historical launch slide documents the released experience.
Students, librarians, scholars, faculty, graduate students, and discipline-specific research groups.
Timeline
2013–2017
2013Young researcher studies
2014Group studies with young researchers
2015Entity-wide contextual inquiry with advanced researchers
2016Shadowing research groups and labs
Research questions
RefWorks was established inside universities, but newer tools were changing researchers’ expectations. Librarians needed a product they could confidently recommend and support. Faculty, graduate students, and research groups needed something that could survive the scale, duration, and collaboration of serious scholarly work.
Studies / investigation
I led multiple phases of research with students, librarians, scholars, and discipline-specific research groups. The work included interviews, observation, contextual inquiry in labs and offices, diary research, surveys, coded NPS, competitive analysis, workflow reconstruction, co-creation, prototyping, and usability testing.
Findings
Citation management was only one part of the job. Researchers moved repeatedly between discovery, reading, annotation, experimentation, collaboration, writing, funding, teaching, and publication. Their needs also expanded as they moved from novice to domain expert and took on more responsibility for other people’s work. The opportunity was continuity across that changing research practice—not a longer list of citation features.
Evidence → decisions
The program produced personas, workflow models, explicit value propositions, and a five-year product horizon. It helped reframe RefWorks as a reusable research environment and guided concepts, features, usability work, and the institutional story communicated to more than 500 librarians.View the RefWorks presentation ↗
At PitchBook, I built shared guidance for planning, conducting, and reporting research. It helped onboard UX designers to run their own studies while giving the team a consistent way to frame questions, select methods, synthesize evidence, and communicate findings.
VIEW THE WORKING OUTLINE ↗Early artifact—the structure is visible, but much of the instructional content is still missing.
01
Plan
Frame the research questions, select an appropriate method, and decide how the work will be synthesized.
02
Conduct
Use shared guidance for qualitative methods, quantitative methods, and usability testing.
03
Report
Turn observations into findings that product and engineering teams can understand and use.
I research decisions, not only screens.
I study who is involved, which information they trust, what limits their choices, and what happens before and after they use the product.
01
Grounded theory
I code and compare evidence across participants, roles, and situations. Collection and analysis evolve together, turning observations into a model a team can inspect and challenge.
02
Enter the work where it happens
I use interviews, contextual inquiry, observation, recorded-session replays, and concrete workflow walkthroughs to understand how people actually work.
03
Synthesize evidence
I triangulate qualitative findings with product analytics, survey and NPS data, market information, system logs, and technical constraints. Contradictions reveal the next question.
04
Model people, workflows + systems
The result might be a workflow, decision model, taxonomy, service map, or research-derived product principles. The model makes relationships and constraints visible.
05
Turn findings into decisions
I work with product, design, data, and engineering to translate findings into requirements, prototypes, architecture, sequencing, and release decisions. I stay with the finding through delivery.
EMERGING PRACTICE
AI for research operations.
I’m exploring how AI can support the work around research: organizing evidence, tracing findings back to their sources, and turning questions into sketches and prototypes. The aim is to make research easier to use while keeping interpretation and judgment accountable to people.
This is an emerging direction that connects with BUTR. For now, I’m developing small experiments around concrete research tasks and documenting what helps, what fails, and what needs human review.
Selected reports, frameworks, and literature reviews that show how I frame questions, synthesize evidence, and develop a point of view.
01
THEORY + SYNTHESIS / 2018
Making Dimensions of Human-Centered Design & Engineering
A framework for locating human-centered work across people, problems, process, and purpose.
This piece maps human-centered work across four dimensions: people, problems, process, and purpose. It explores how practices move between individual experiences and larger systems, where disciplinary approaches overlap, and how making a framework reveals the assumptions of its maker.
A practical argument for making smart tradeoffs in usability research without trading away the integrity of the evidence.
A response to Susan Dray and David Siegel’s 1999 article on cost-effective usability practice, grounded in my own experience conducting product research at RefWorks and Socrata.
CONFERENCE REPORT + PUBLIC INTEREST TECHNOLOGY / 2020
Building Community-Centered Civil Justice Open Data Initiatives
A framework for making civil-justice data open, useful, ethical, and accountable to the communities represented within it.
Presented with Abhijeet Chavan and Maureen Johnson at the 2020 Self-Represented Litigation Network Conference in Nashville. The session connected open-government practice, civil-justice reform, data governance, and community participation.
A literature review examining how groups notice cues, build interpretations, and act through shared analytical systems.
Created for HCDE 548 at the University of Washington. The review systematically examined 22 ACM papers and additional cited literature across HCI, CSCW, and visual analytics.
Always rigorous enough to trust.Always useful enough to act on.
I love researching complex people, technology, and processes. Understanding how systems actually work—and finding consequential questions that can change them—is where I find professional joy.